COVID-19 outbreak model
The computational models and computer simulations are one of the available research tools that epidemiologists can exploit to better understand the spreading characteristics of COVID-19 and to decide the social measures to counter, mitigate or simply delay the spread of the infectious diseases.
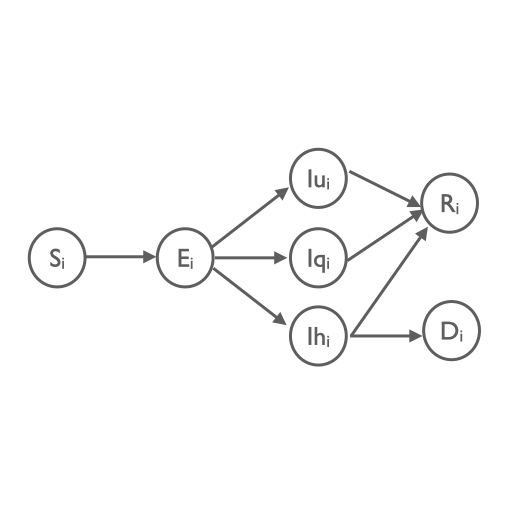
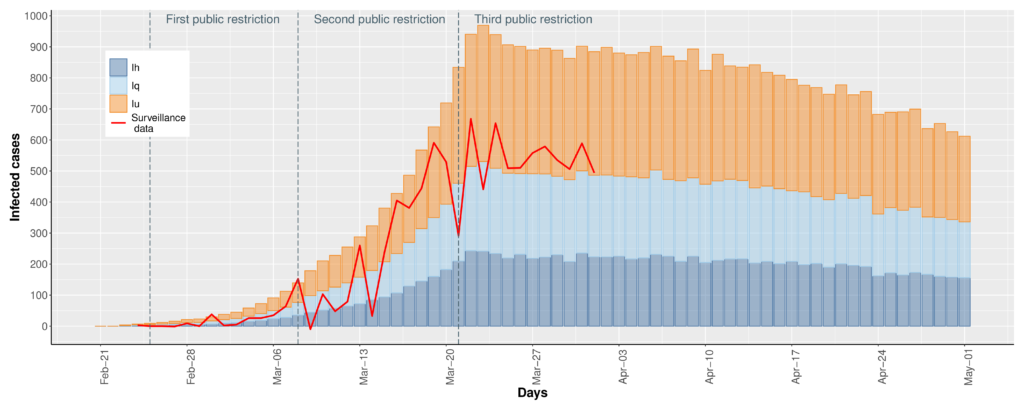
Our study presents an extended version of Susceptible-Exposed-Infected-Removed (SEIR) model in which the population age is taken into account and the infectious population is divided into three sub-classes: (i) undetected infected individuals, (ii) quarantined infected individuals and (iii) hospitalized infected individuals. Moreover, the strength of the government restriction actions and the related population response are explicitly represented in the model.
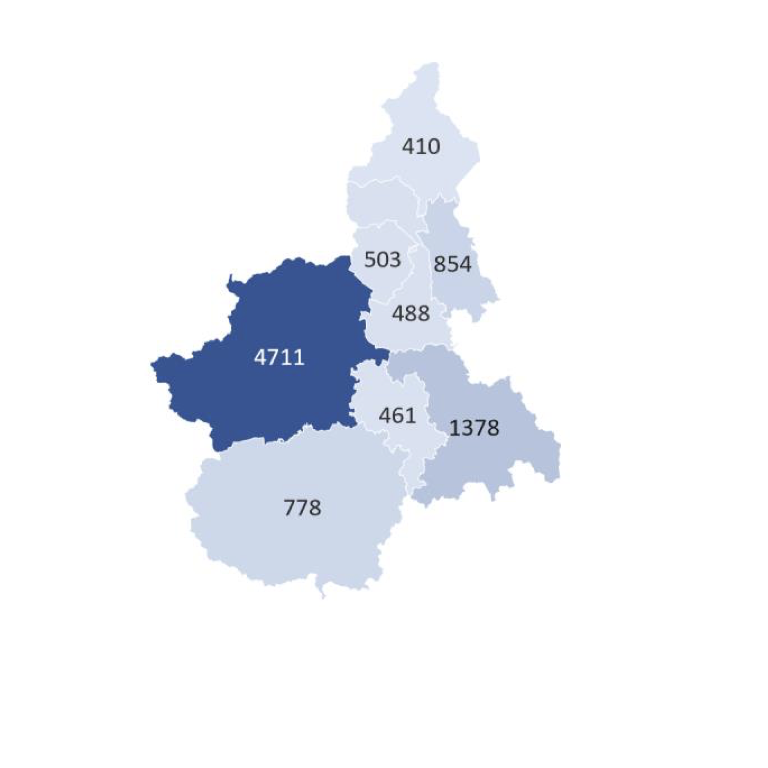
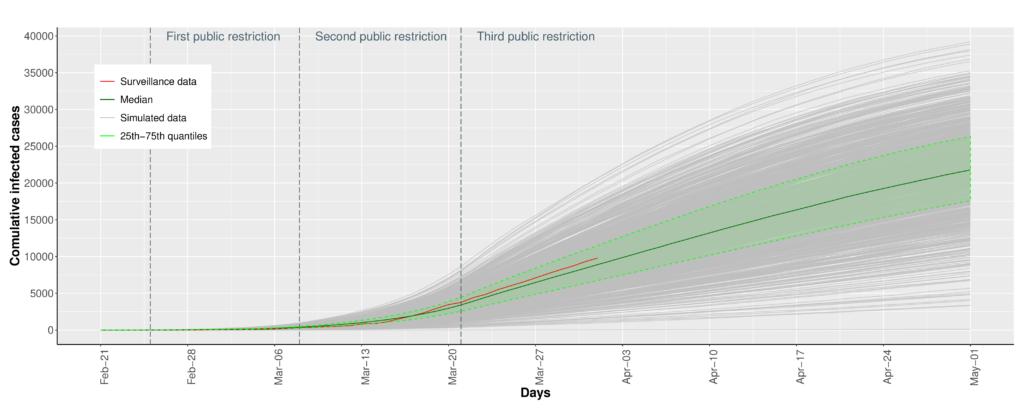
The proposed model allows us to investigate different scenarios of the COVID-19 spread in Piedmont by varying the force of population response and the proportion between detected and undetected infected individuals. Our results show that the implemented control measures have proven effective in containing the epidemic, neutralizing, or at least limiting, the potential dangerous impact of a large proportion of undetected cases.
Our model is an effective tool useful to investigate different scenarios and to inform policy makers about the potential impact of different control strategies. This will be crucial in the upcoming months, when very critical decisions about easing control measures will need to be taken.
Our preliminary results are discussed in the following pre-print:
Pernice, S., Castagno, P., Marcotulli, L., Maule, M., Richiardi, L., Moirano, G., Sereno M., Cordero, F., Beccuti, M. Undetected Cases of Covid-19 and Effects of Social Distancing Strategies: a Modeling Study in Piedmont Region.
E&P Code: repo.epiprev.it/929
This interdisciplinary work is a collaboration of three research groups of the University of Turin: the group of Quantitative Biology (Dr Marco Beccuti and Dr Francesca Cordero), the group of Quantitative Modelling and Systems Performance Evaluation (Prof. Matteo Sereno), and the Epidemiology group (Prof. Lorenzo Richiardi).